基于dropwizard/metrics ,kafka,zabbix构建应用统计数据收集展示系统 |
您所在的位置:网站首页 › Dropwizard Metrics › 基于dropwizard/metrics ,kafka,zabbix构建应用统计数据收集展示系统 |
基于dropwizard/metrics ,kafka,zabbix构建应用统计数据收集展示系统
|
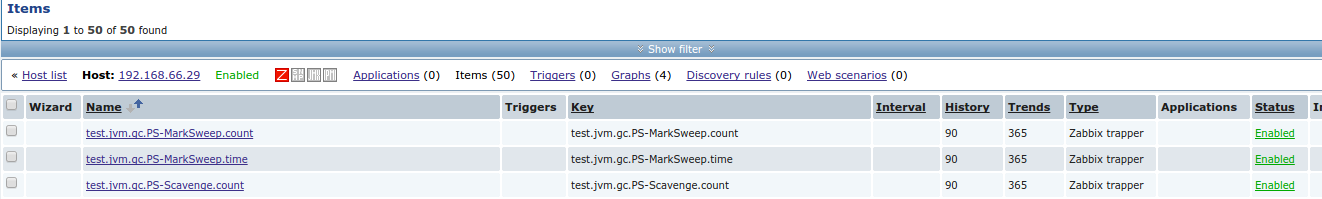
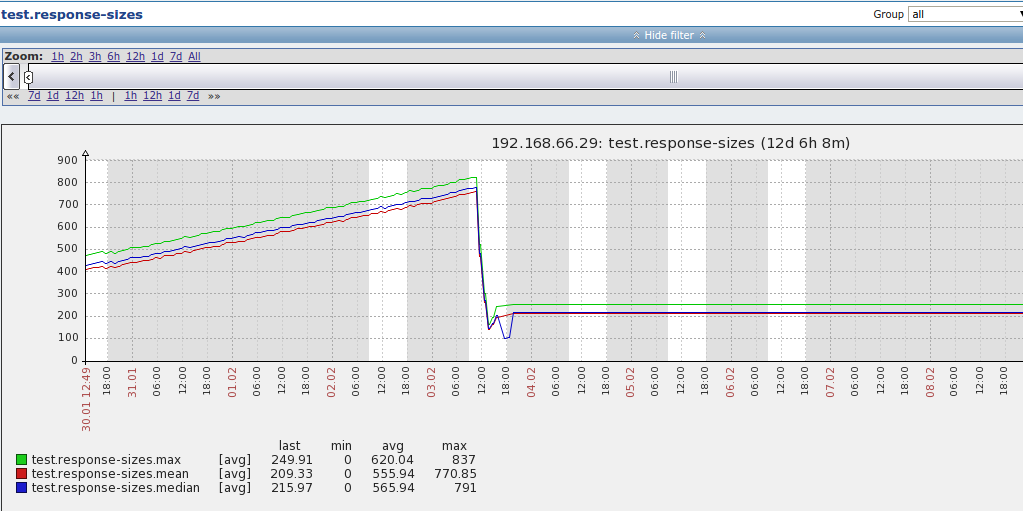
新blog地址:http://hengyunabc.github.io/about-metrics/ 想要实现的功能 应用可以用少量的代码,实现统计某类数据的功能 统计的数据可以很方便地展示 metricsmetrics,按字面意思是度量,指标。 举具体的例子来说,一个web服务器: - 一分钟内请求多少次? - 平均请求耗时多长? - 最长请求时间? - 某个方法的被调用次数,时长? 以缓存为例: - 平均查询缓存时间? - 缓存获取不命中的次数/比例? 以jvm为例: - GC的次数? - Old Space的大小? 在一个应用里,需要收集的metrics数据是多种多样的,需求也是各不同的。需要一个统一的metrics收集,统计,展示平台。 流行的metrics的库https://github.com/dropwizard/metrics java实现,很多开源项目用到,比如hadoop,kafka。下面称为dropwizard/metrics。 https://github.com/tumblr/colossus scala实现,把数据存到OpenTsdb上。 spring boot 项目里的metrics: http://docs.spring.io/spring-boot/docs/current/reference/html/production-ready-metrics.html spring boot里的metrics很多都是参考dropwizard/metrics的。 metrics的种类dropwizard/metrics 里主要把metrics分为下面几大类: https://dropwizard.github.io/metrics/3.1.0/getting-started/ Gaugesgauge用于测量一个数值。比如队列的长度: public class QueueManager { private final Queue queue; public QueueManager(MetricRegistry metrics, String name) { this.queue = new Queue(); metrics.register(MetricRegistry.name(QueueManager.class, name, "size"), new Gauge() { @Override public Integer getValue() { return queue.size(); } }); } } Counterscounter是AtomicLong类型的gauge。比如可以统计阻塞在队列里的job的数量: private final Counter pendingJobs = metrics.counter(name(QueueManager.class, "pending-jobs")); public void addJob(Job job) { pendingJobs.inc(); queue.offer(job); } public Job takeJob() { pendingJobs.dec(); return queue.take(); } Histogramshistogram统计数据的分布。比如最小值,最大值,中间值,还有中位数,75百分位, 90百分位, 95百分位, 98百分位, 99百分位, and 99.9百分位的值(percentiles)。 比如request的大小的分布: private final Histogram responseSizes = metrics.histogram(name(RequestHandler.class, "response-sizes")); public void handleRequest(Request request, Response response) { // etc responseSizes.update(response.getContent().length); } Timerstimer正如其名,统计的是某部分代码/调用的运行时间。比如统计response的耗时: private final Timer responses = metrics.timer(name(RequestHandler.class, "responses")); public String handleRequest(Request request, Response response) { final Timer.Context context = responses.time(); try { // etc; return "OK"; } finally { context.stop(); } } Health Checks这个实际上不是统计数据。是接口让用户可以自己判断系统的健康状态。如判断数据库是否连接正常: final HealthCheckRegistry healthChecks = new HealthCheckRegistry(); public class DatabaseHealthCheck extends HealthCheck { private final Database database; public DatabaseHealthCheck(Database database) { this.database = database; } @Override public HealthCheck.Result check() throws Exception { if (database.isConnected()) { return HealthCheck.Result.healthy(); } else { return HealthCheck.Result.unhealthy("Cannot connect to " + database.getUrl()); } } } Metrics Annotation利用dropwizard/metrics 里的annotation,可以很简单的实现统计某个方法,某个值的数据。 如: /** * 统计调用的次数和时间 */ @Timed public void call() { } /** * 统计登陆的次数 */ @Counted public void userLogin(){ }想要详细了解各种metrics的实际效果,简单的运行下测试代码,用ConsoleReporter输出就可以知道了。 metrics数据的传输和展示dropwizard/metrics 里提供了reporter的接口,用户可以自己实现如何处理metrics数据。 dropwizard/metrics有不少现成的reporter: ConsoleReporter 输出到stdout JmxReporter 转化为MBean metrics-servlets 提供http接口,可以查询到metrics信息 CsvReporter 输出为CSV文件 Slf4jReporter 以log方式输出 GangliaReporter 上报到Ganglia GraphiteReporter 上报到Graphite上面的各种reporter中,Ganglia开源多年,但缺少一些监控的功能,图形展示也很简陋。Graphite已经停止开发了。 而公司所用的监控系统是zabbix,而dropwizard/metrics没有现成的zabbix reporter。 zabbix的限制zabbix上报数据通常用zabbix agent或者zabbix trapper。 用户自己上报的数据通常用zabbix trapper来上报。 zabbix上收集数据的叫item,每个item都有自己的key,而这些item不会自动创建。zabbix有Low-level discovery,可以自动创建item,但是也相当麻烦,而且key的命名非常奇怪。不如直接用template了。 https://www.zabbix.com/documentation/2.4/manual/discovery/low_level_discovery 假定zabbix上不同的应用的key都是相对固定的,那么就可以通过模板的方式,比较方便地统一创建item, graph了。 另外想要实现自动创建item,比较好的办法是通过zabbix api了。 但目前Java版没有实现,于是实现了一个简单的: https://github.com/hengyunabc/zabbix-api dropwizard/metrics zabbix reporter基于上面的template的思路,实现了一个dropwizard/metrics 的zabbix reporter。 原理是,通过zabbix sender,把metrics数据直接发送到zabbix server上。 https://github.com/hengyunabc/zabbix-sender https://github.com/hengyunabc/metrics-zabbix dropwizard/metrics发送到kafka,再从kafka发到zabbix上面的方案感觉还是不太理想: - 没有实现自动化,还要手动为每一个应用配置template,不够灵活 - 所有的数据都发送到一个zabbix server上,担心性能有瓶颈 于是,新的思路是,把metrics数据发送到kafka上,然后再从kafka上消费,再把数据传到zabbix server上。 这样的好处是: - kafka可以灵活扩容,不会有性能瓶颈 - 从kafka上消费metrics数据,可以灵活地用zabbix api来创建item, graph 于是实现了两个新项目: - https://github.com/hengyunabc/metrics-kafka - https://github.com/hengyunabc/kafka-zabbix Java程序先把metrics数据上报到kafka,然后kafka consumer从metrics数据里,提取出host, key信息,再用zabbix-api在zabbix server上创建item,最后把metrics数据上报给zabbix server。 自动创建的zabbix item的效果图: 在zabbix上显示的用户自定义的统计数据的图: 比如,统计接口的访问次数,而这个接口部署在多台服务器上,那么如何展示聚合的数据? zabbix自带有聚合功能,参考: http://opsnotes.net/2014/10/24/zabbix_juhe/ 实战:Zabbix 聚合功能配置与应用 metrics的实现的探讨从dropwizard/metrics里,我们可以看到一种简单直观的实现: - app内收集统计数据,计算好具体的key/value - 定时上报 另外,用分布式调用追踪(dapper/zipkin)的办法,也可以实现部分metrics的功能。 比如某个方法的调用次数,缓存命中次数等。 当然,两者只是部分功能有重合。 dropwizard/metrics 是一种轻量级的手段,用户可以随意增加自己想要的统计数据,代码也很灵活。有些简单直观的统计数据如果用分布式调用追踪的方式来做,显然会比较吃力,得不偿失。 总结本文提出并实现了,利用dropwizard/metrics做数据统计,kafka做数据传输,zabbix做数据展示的完整流程。 对于开发者来说,不需要关心具体的实现,只需要按dropwizard/metrics的文档做统计,再配置上metrics-kafka reporter即可。 |
【本文地址】